EntropyHeatmap Pro
Overview
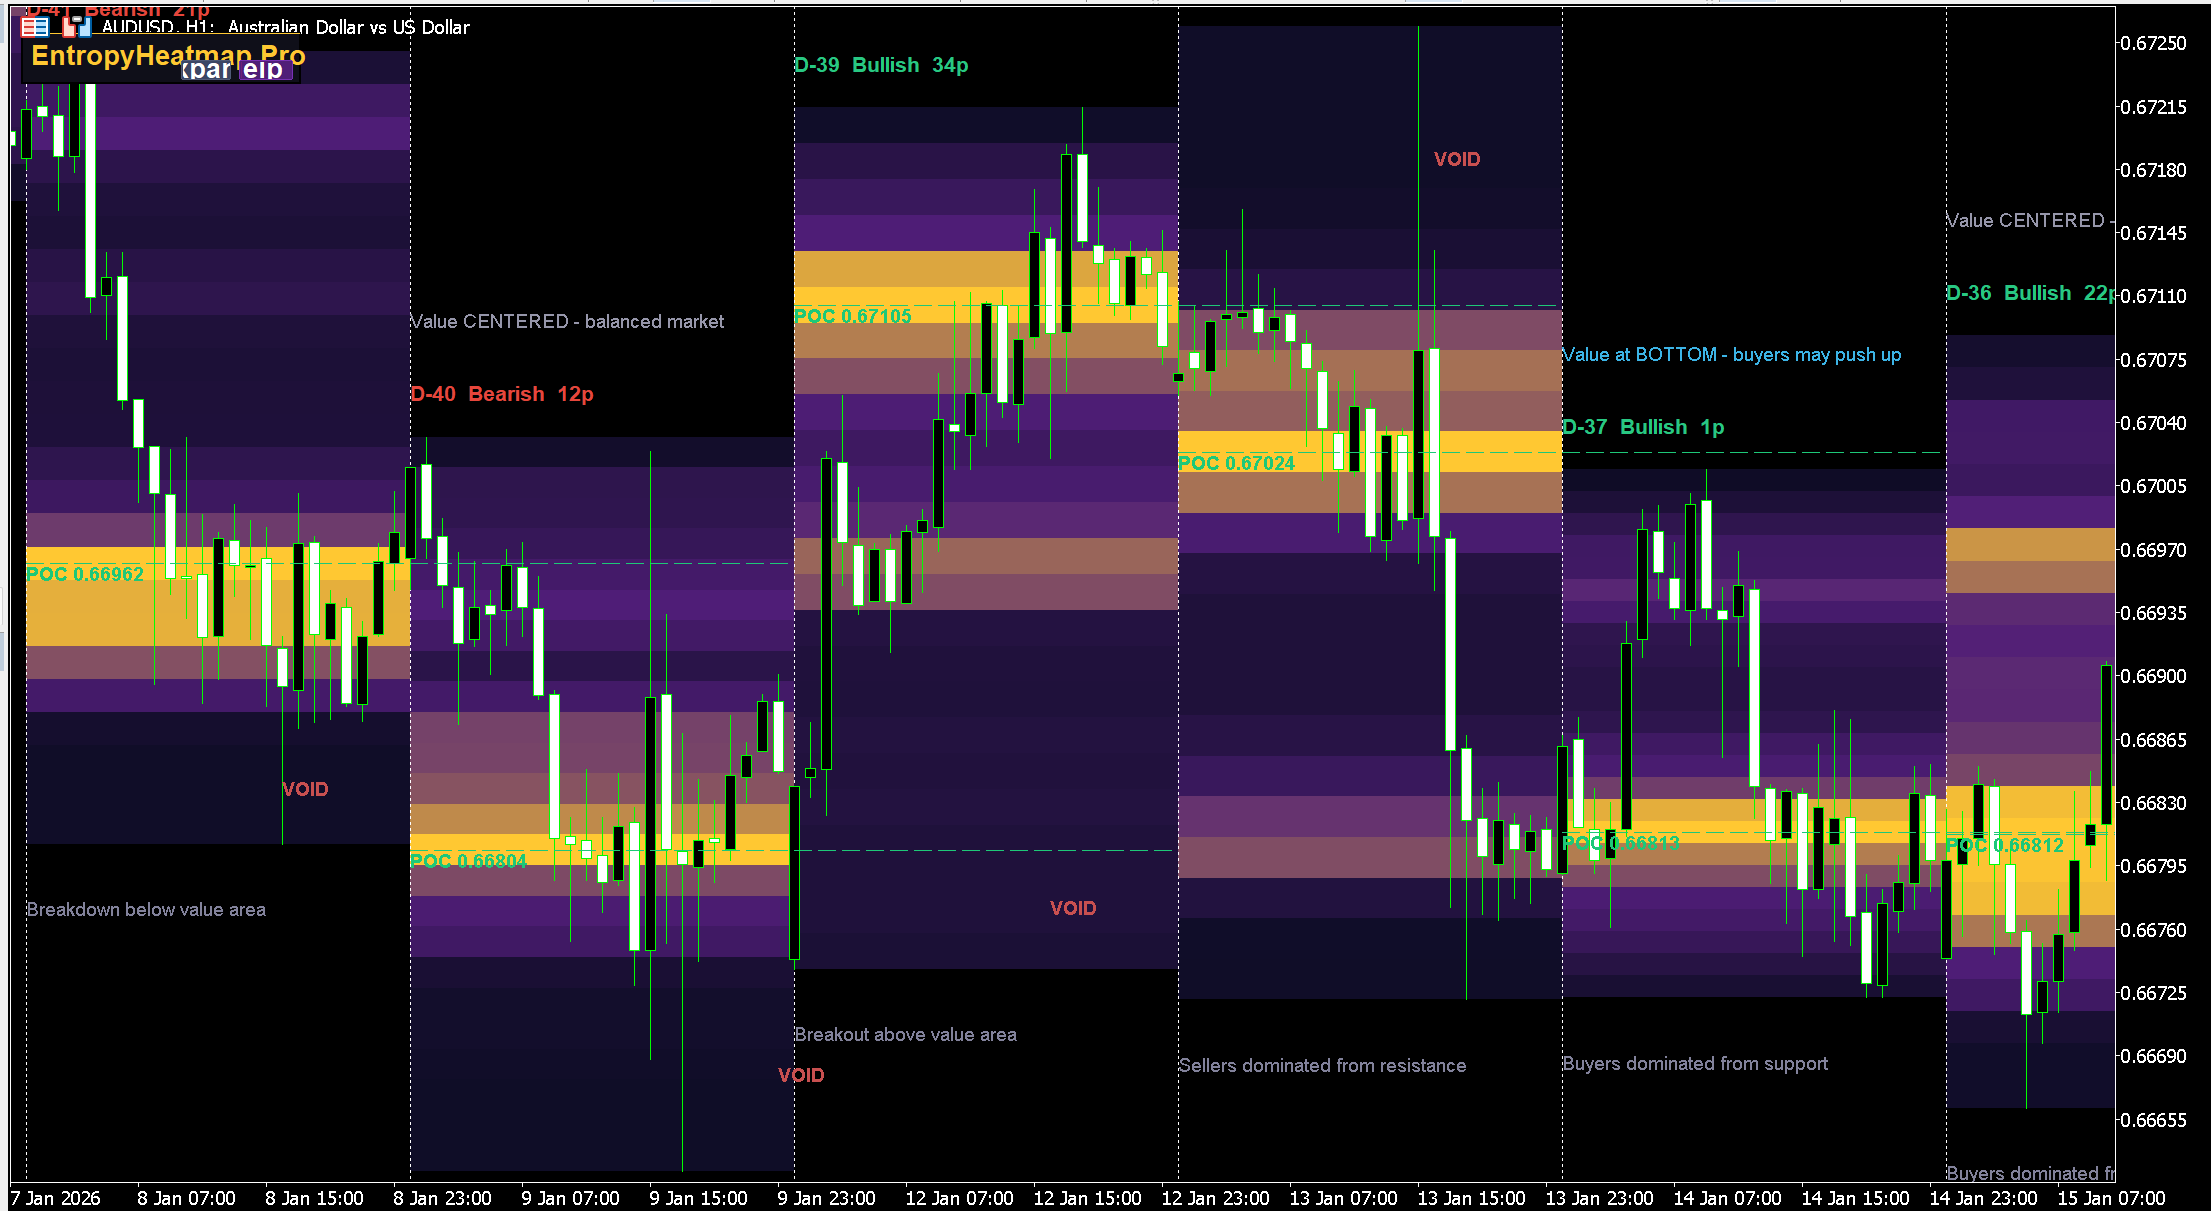
EntropyHeatmap Pro builds a visual heatmap of price density for each trading session. Instead of relying on unreliable tick volume data, it measures where price actually spent time — giving you a true picture of market interest at each price level.
Bright zones show where the market found "fair value" (institutional interest). Dark zones reveal liquidity voids where price moved fast with no resistance.
How It Works (No Tick Volume)
For each price level (row), the indicator calculates:
- Candle body overlap with the row → weight x3 (price traded here, real interest)
- Candle wick overlap with the row → weight x1 (price touched but was rejected)
The more candle bodies overlap a level, the brighter it appears. This is pure price action analysis — no broker-dependent tick data.
Three Density Modes
- BodyTime (default) — weighted body (3x) and wick (1x) overlap
- TouchCount — simple count of how many bars touched each level
- Combined — both methods averaged for maximum accuracy
POC (Point of Control)
The price level with the highest density in each session. This is where the market spent the most time — it acts as a magnet for future price action.
- Green POC = below current price (potential support)
- Red POC = above current price (potential resistance)
- Today's POC = solid thick line
- Historical POC = dashed line, extends max 2 days forward
Daily Annotations
Each session includes four automatic labels:
Top of session: Day name + trend + body size in pips
Example: TODAY Bullish 72p
Below that: POC position analysis
- "Value at TOP — sellers may push down"
- "Value at BOTTOM — buyers may push up"
- "Value CENTERED — balanced market"
Inside dark zones: Red VOID label marking the biggest liquidity gap
Bottom of session: Trading hint
- Today: "Price ABOVE POC — look for Buy dips to POC"
- History: "Buyers dominated from support" or "Breakdown below value area"
Trading Strategy
- Bright zone = Support/Resistance — price tends to bounce from high-density areas
- Dark void = Fast move expected — price will shoot through these gaps
- POC = Magnet — price often returns to POC during the session
- POC shift — ascending POC = bullish trend, descending = bearish
- Mean reversion — when price deviates far from POC, expect a pullback
Settings
| Parameter | Default | Description |
|---|---|---|
| DaysToShow | 5 | Number of sessions to display |
| NumRows | 24 | Vertical price resolution (5-60) |
| DensityMode | BodyTime | Calculation method |
| ShowPOC | true | Show Point of Control lines |
| ExtendPOC | true | Extend POC lines forward (max 2 days) |
How to Install
- Download .mq4 (MT4) or .mq5 (MT5)
- Copy to MQL4/Indicators or MQL5/Indicators
- Restart terminal, drag onto chart
- Set DaysToShow and NumRows as needed
Free Download
This indicator is free. To prevent unauthorized distribution, it is compiled individually for your MetaTrader 4 / MetaTrader 5 trading account. Register and provide your MT4/MT5 account number to receive a personalized file.