FractalZone Levels Pro
Overview
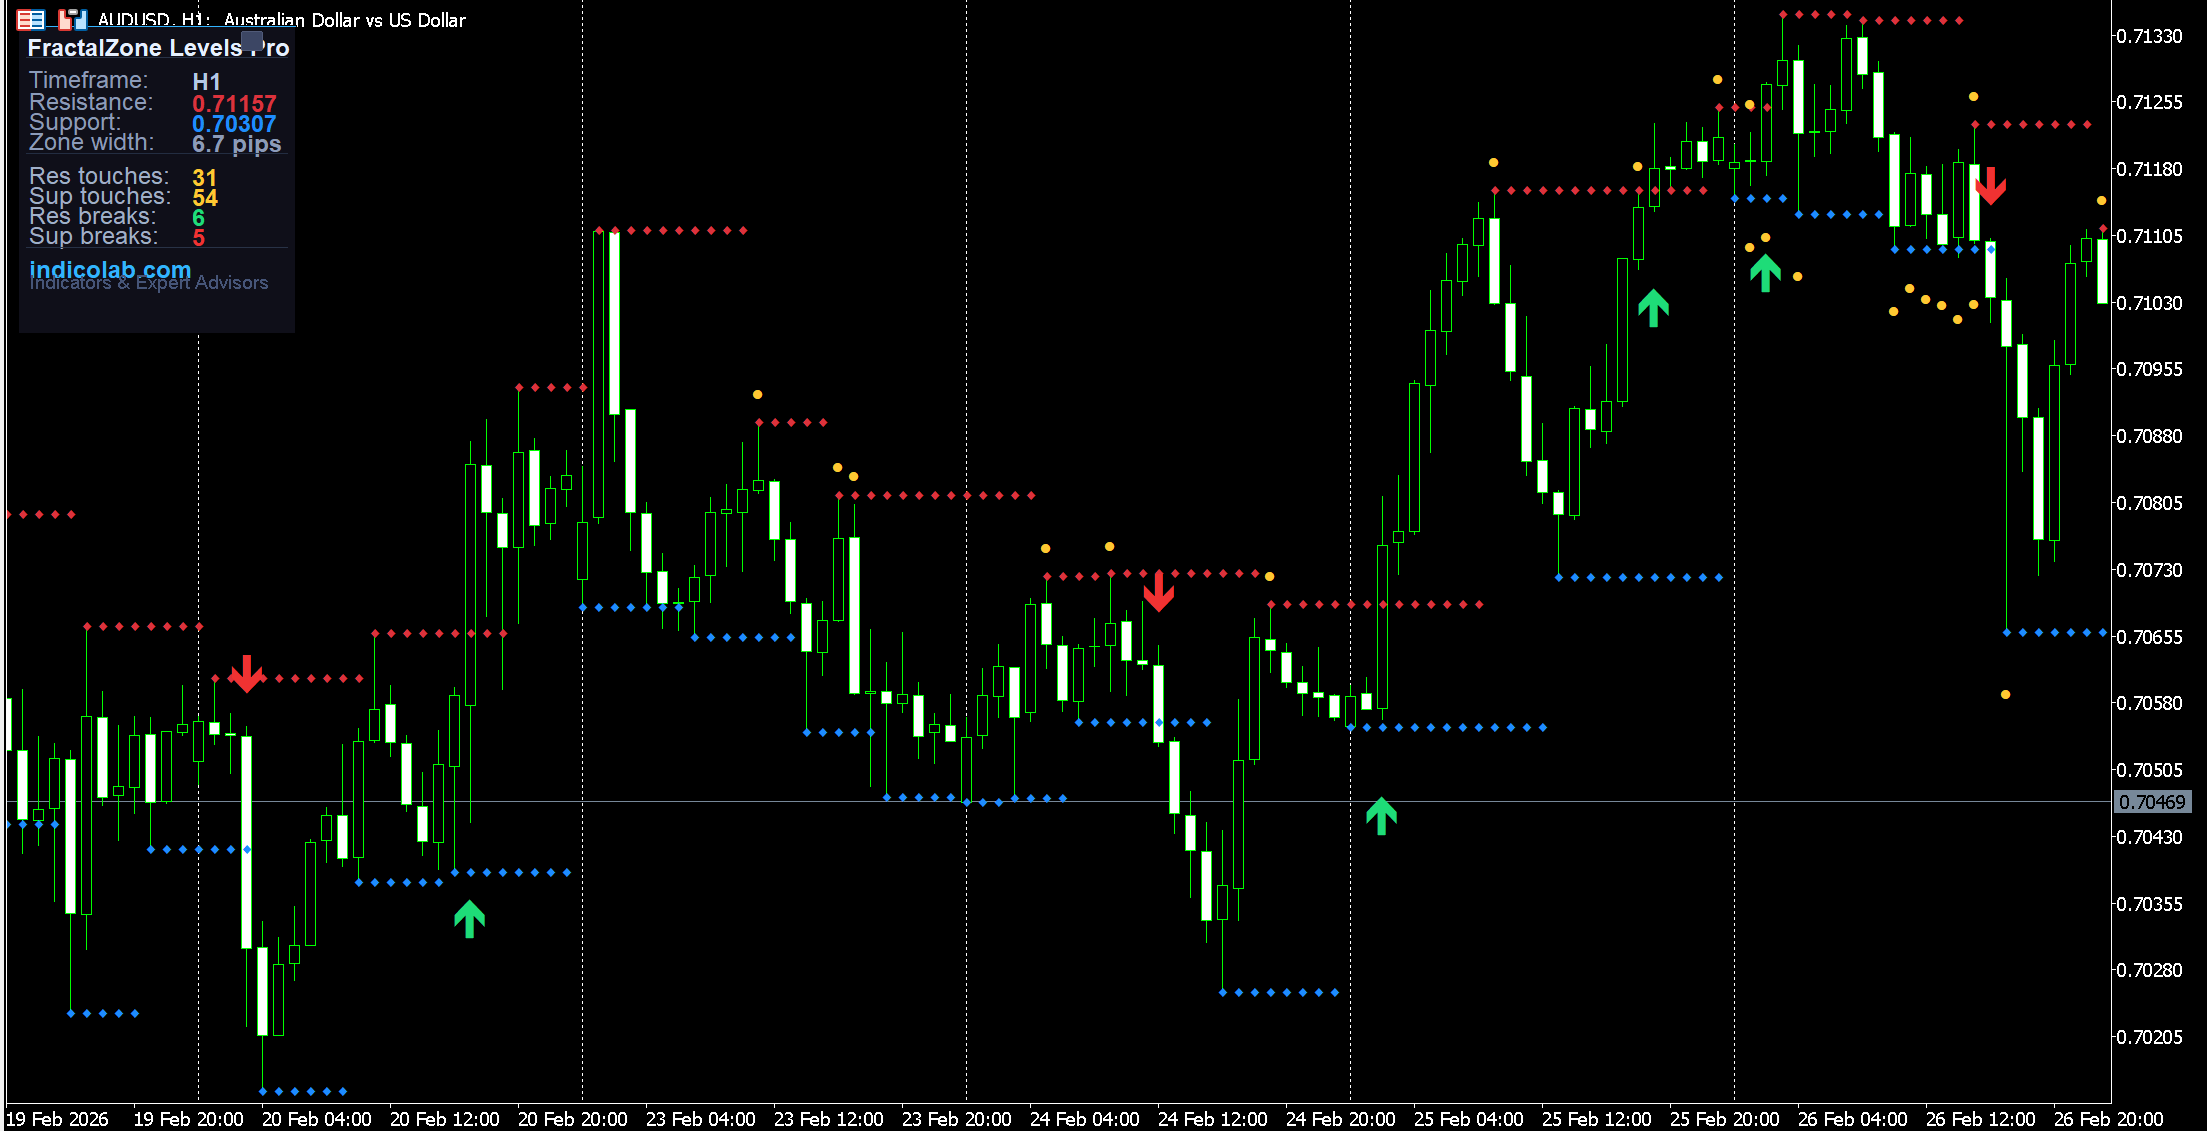
FractalZone Levels Pro automatically identifies support and resistance levels using fractal highs and lows, then enhances them with colored zones, touch markers, and break detection arrows. Instead of simple lines, you get a complete picture of how price interacts with each level.
The indicator answers the most important question: Is this level holding or breaking?
How It Works
The indicator uses the built-in Fractals algorithm to detect swing highs and swing lows:
- Resistance = the most recent fractal high (red line)
- Support = the most recent fractal low (blue line)
When a new fractal forms, the level updates. Between fractals, the level stays flat — creating a clear horizontal reference that tracks the current support/resistance.
Colored Zones
Instead of thin lines, the indicator draws colored zones around each level:
- Red zone around resistance — shows the area where selling pressure exists
- Blue zone around support — shows the area where buying pressure exists
- Zone width is calculated dynamically using ATR (Average True Range) — wider in volatile markets, tighter in calm markets
- Four zone styles: Off, Thin, Medium, Wide
This gives you a realistic view of S/R as areas, not exact prices.
Touch & Break Detection
The indicator automatically detects and marks two critical events:
Touches (yellow dots):
- Price approached the level but didn't break it
- More touches = stronger level
- Shown as small yellow markers near the level
Breaks (colored arrows):
- Green arrow up = price closed above resistance (bullish breakout)
- Red arrow down = price closed below support (bearish breakdown)
- Alerts available for breaks: popup, email, and push notifications
Draggable Statistics Panel
The professional dark-themed panel shows real-time data:
- Current Resistance and Support prices
- Zone width in pips (auto-calculated from ATR)
- Touch counts — how many times each level was tested
- Break counts — how many times levels were broken
- Timeframe display
Panel features:
- Drag anywhere on chart
- [_] minimize to title bar
- [+] restore full panel
- [?] open built-in help guide
Built-in Help Guide
Press [?] for an interactive guide explaining:
- How fractal-based S/R works
- What zones and markers mean
- Trading strategies
- Panel usage tips
Trading Strategies
-
Range Trading — Buy near support zone, sell near resistance zone. More touches on a level = higher probability of holding.
-
Breakout Trading — When a green/red arrow appears (break signal), wait for a retest of the broken level and enter in the breakout direction.
-
Zone Width Analysis — Wide zones (high ATR) mean uncertain S/R — use wider stops. Narrow zones (low ATR) mean precise levels — use tighter stops.
-
Touch Count Strategy — A level with 3+ touches that hasn't broken is very strong. Look for bounces with high confidence at these levels.
-
Break Frequency — If breaks are frequent (high break count), the market is trending. If touches are frequent (high touch count), the market is ranging.
Settings
| Parameter | Default | Description |
|---|---|---|
| ResistanceColor | Red | Resistance line color |
| SupportColor | Blue | Support line color |
| LineWidth | 2 | S/R line width |
| ShowZoneLabels | true | Price labels at levels |
| ZoneStyle | Medium | Zone thickness (Off/Thin/Medium/Wide) |
| ZoneMaxBars | 100 | Max zone extension in bars |
| ShowTouchMarks | true | Yellow touch markers |
| ShowBreakArrows | true | Break arrows on chart |
| EnableAlerts | false | Popup alerts on break |
| EnableEmail | false | Email alerts on break |
| EnablePush | false | Mobile push on break |
| TriggerCandle | Previous | Alert trigger (current or confirmed) |
How to Install
- Download the
.mq4file (for MT4) or.mq5file (for MT5) - Copy to
MQL4/IndicatorsorMQL5/Indicatorsfolder - Restart the terminal or refresh Navigator panel
- Drag the indicator onto any chart
- Adjust zone style and colors to your preference
Compatibility
- MetaTrader 4 — full support, all timeframes
- MetaTrader 5 — full support, all timeframes (M1-MN)
- Works on any instrument: Forex, Crypto, Metals, Indices, Stocks
- Uses built-in Fractals and ATR indicators (no external dependencies)
- Minimal CPU usage
Features
- 1. Fractal-based automatic support & resistance detection
- 2. Dynamic colored zones with ATR-adjusted width
- 3. Touch detection with yellow markers showing level tests
- 4. Break detection with green/red arrows for breakouts
- 5. Real-time statistics: touches and breaks count
- 6. Price labels showing exact S/R levels on chart
- 7. Multi-channel alerts: popup, email, push notifications
- 8. Draggable panel — move anywhere on the chart
- 9. Collapsible panel — minimize/restore with one click
- 10. Built-in interactive help guide with trading strategies