LiquidityStorm Pro
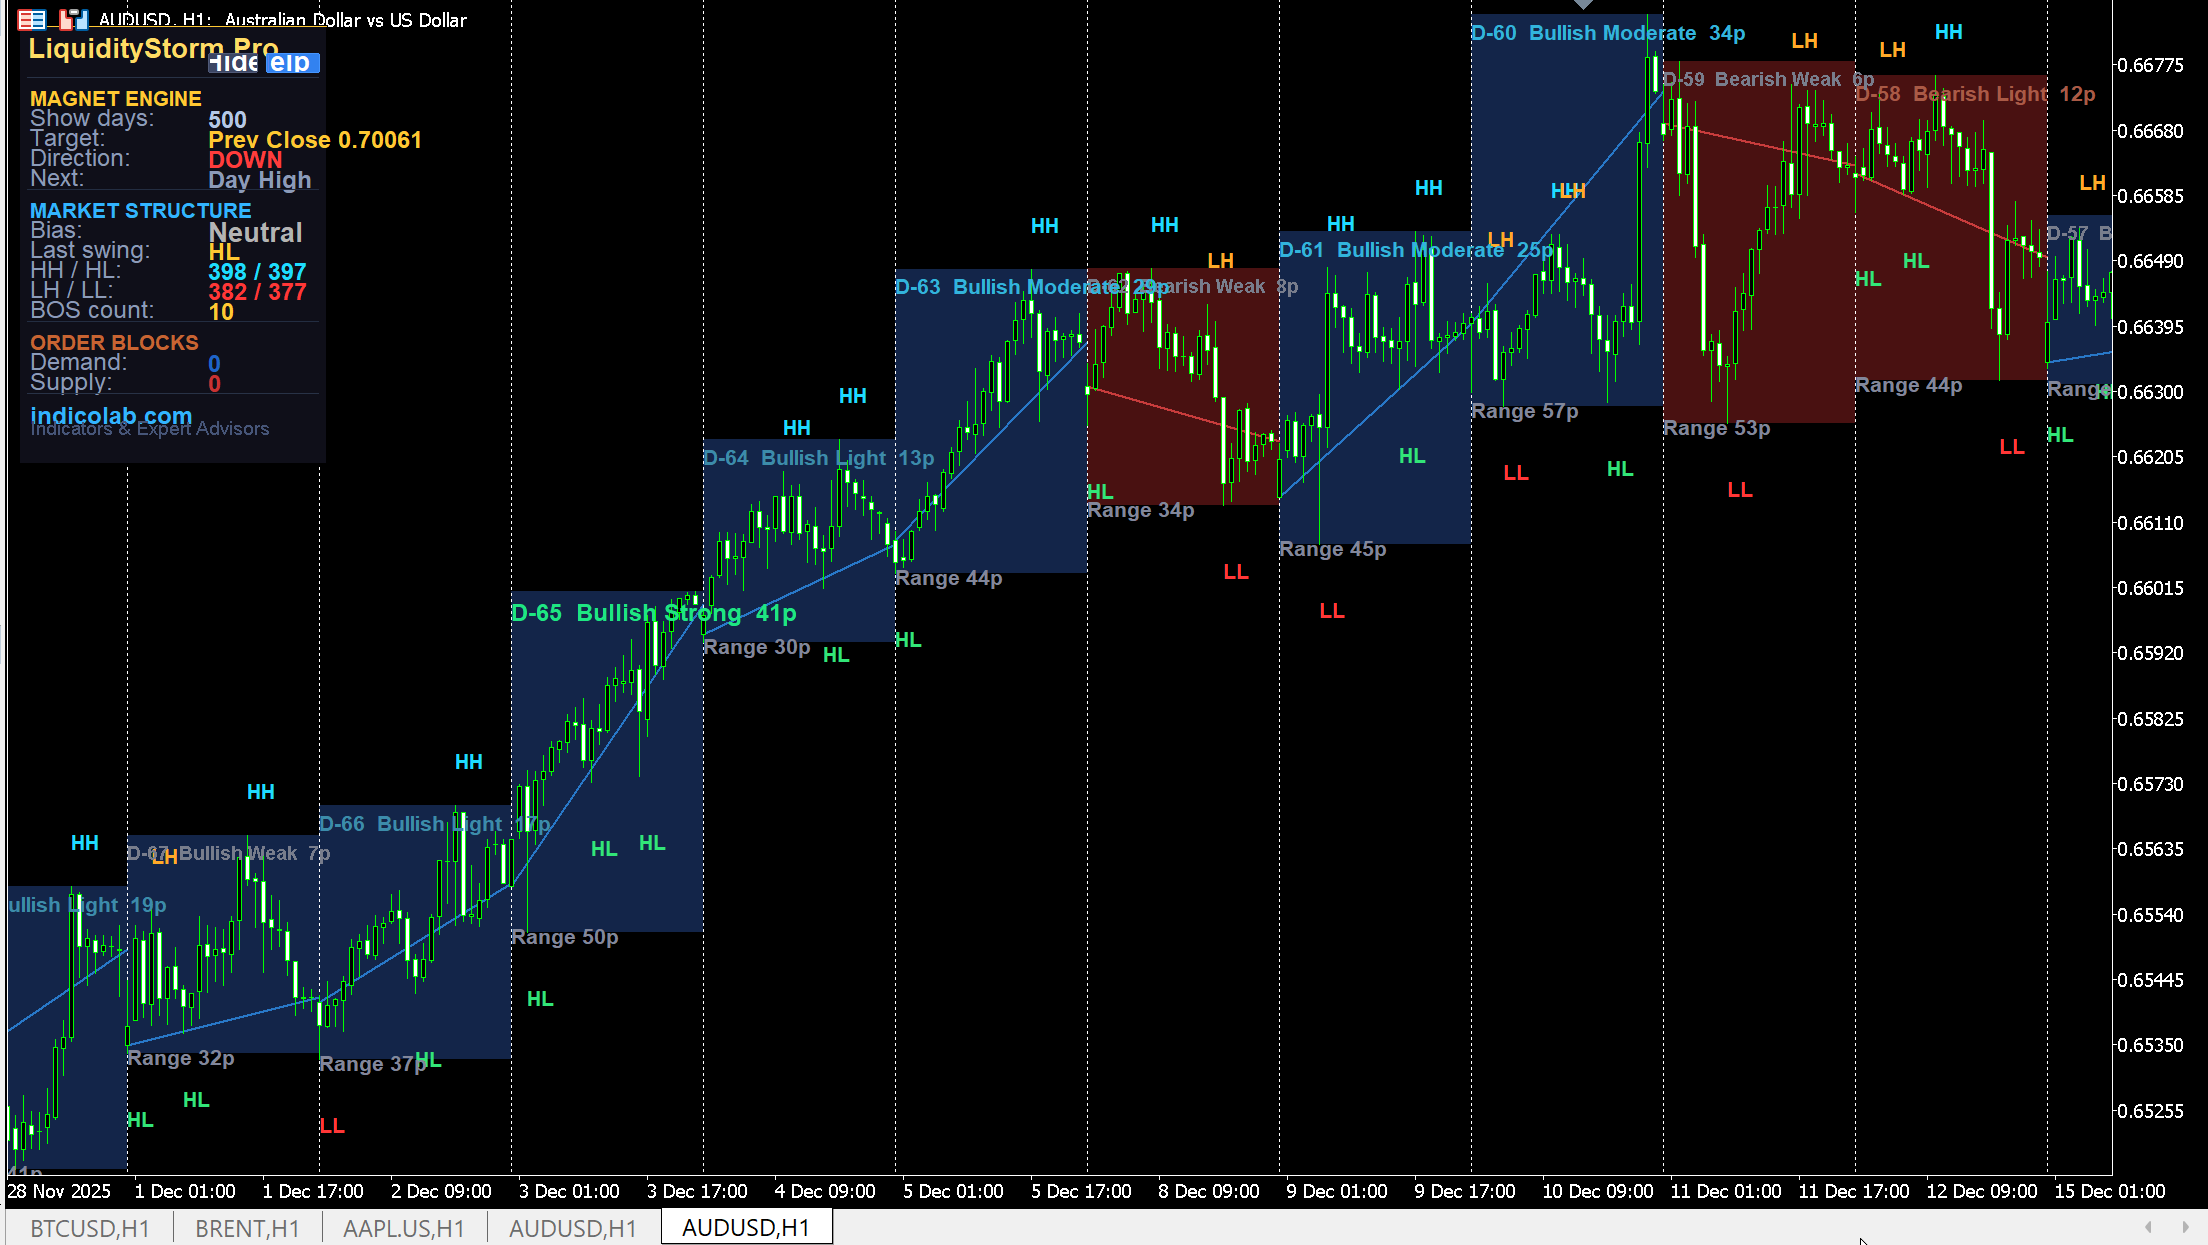
LiquidityStorm Pro is a multi-module institutional trading tool that combines three analysis systems in one indicator. It shows where price is heading (Magnet Engine), what the market structure looks like (HH/HL/LH/LL + BOS), and where institutional orders are sitting (Order Blocks). Each trading day is displayed as a visual box with relative strength rating.
Module 1: Market Structure
Automatically detects swing highs and lows using pivot analysis, then labels each swing point directly on the chart:
- HH (Higher High) — cyan, bullish continuation
- HL (Higher Low) — green, bullish support
- LH (Lower High) — orange, bearish pressure
- LL (Lower Low) — red, bearish continuation
- BOS (Break of Structure) — marks the exact bar where the trend reverses, green for bullish break, red for bearish
The panel displays current Bias (BULLISH / BEARISH / Neutral), last swing type, counts of each label, and total BOS events.
Module 2: Order Blocks
Identifies institutional Demand and Supply zones based on displacement candles (moves exceeding 1.5x ATR):
- Demand Zone (Buy) — blue box, the last bearish candle before a strong bullish move. Price is expected to bounce up from this zone.
- Supply Zone (Sell) — red box, the last bullish candle before a strong bearish move. Price is expected to reverse down from this zone.
- Each zone is labeled ACTIVE (untouched, still valid for entry) or MITIGATED (price already returned and filled the zone)
- Zones end where price mitigates them — no infinite lines stretching across the chart
Module 3: Magnet Engine + Daily Strength Boxes
Magnet Engine shows where price is most likely heading:
- Target — the nearest daily liquidity level (Day High, Day Low, Prev High, etc.)
- Direction — UP or DOWN with arrow on chart
- Next — second-closest level after the magnet target
Daily Boxes show each trading day as a colored rectangle:
- Blue box = bullish day (Close > Open)
- Red box = bearish day (Close < Open)
- Open-to-Close line inside each box shows the day's body
Relative Strength Rating — each day is compared to ALL other visible days:
- Strong — top 25% of days by body size (bright green/red, larger font)
- Moderate — 50-75th percentile (medium color)
- Light — 25-50th percentile (softer color)
- Weak — bottom 25% (gray, smaller font)
This makes it easy to see at a glance which days had the most decisive moves, relative to recent history.
Trading Strategy
- Check Bias — Look at Market Structure panel: BULLISH or BEARISH
- Find Entry Zone — Look for an ACTIVE Demand Zone (in bullish bias) or Supply Zone (in bearish bias)
- Confirm with Magnet — Magnet direction should align with your trade
- Enter at OB — When price reaches an active Order Block in the trend direction
- Target — Use the Magnet level as your take-profit
- Daily Strength — Strong days confirm trend, Weak days suggest consolidation
Settings
| Parameter | Default | Description |
|---|---|---|
| DaysToShow | 5 | Days of history to display (first setting) |
| StructPivotLen | 5 | Pivot lookback for swing detection |
| ShowOB | true | Show Order Blocks |
| OBATRMult | 1.5 | Displacement threshold (x ATR) |
| ShowMagnet | true | Show Magnet Engine |
| ShowDailyLevels | true | Show daily level boxes |
How to Install
- Download .mq4 (MT4) or .mq5 (MT5)
- Copy to MQL4/Indicators or MQL5/Indicators
- Restart terminal, drag onto any chart
- Adjust DaysToShow for your preferred history depth
Features
- Market Structure with HH/HL/LH/LL labels and automatic bias detection
- Break of Structure (BOS) with cooldown — no duplicate signals
- Order Blocks — Demand and Supply zones from displacement candles
- ACTIVE/MITIGATED status labels inside each Order Block zone
- Magnet Engine showing nearest liquidity target with direction arrow
- Daily Strength Boxes with relative power rating (Strong/Moderate/Light/Weak)
- Each day compared to all visible days — relative ranking, not absolute
- Body size in pips and range shown inside each daily box
- Auto-redraw when objects disappear — never lose your analysis
- DaysToShow as first setting — easy control of history depth
Free Download
This indicator is free. To prevent unauthorized distribution, it is compiled individually for your MetaTrader 4 / MetaTrader 5 trading account. Register and provide your MT4/MT5 account number to receive a personalized file.