Market Structure Navigator Pro
Overview
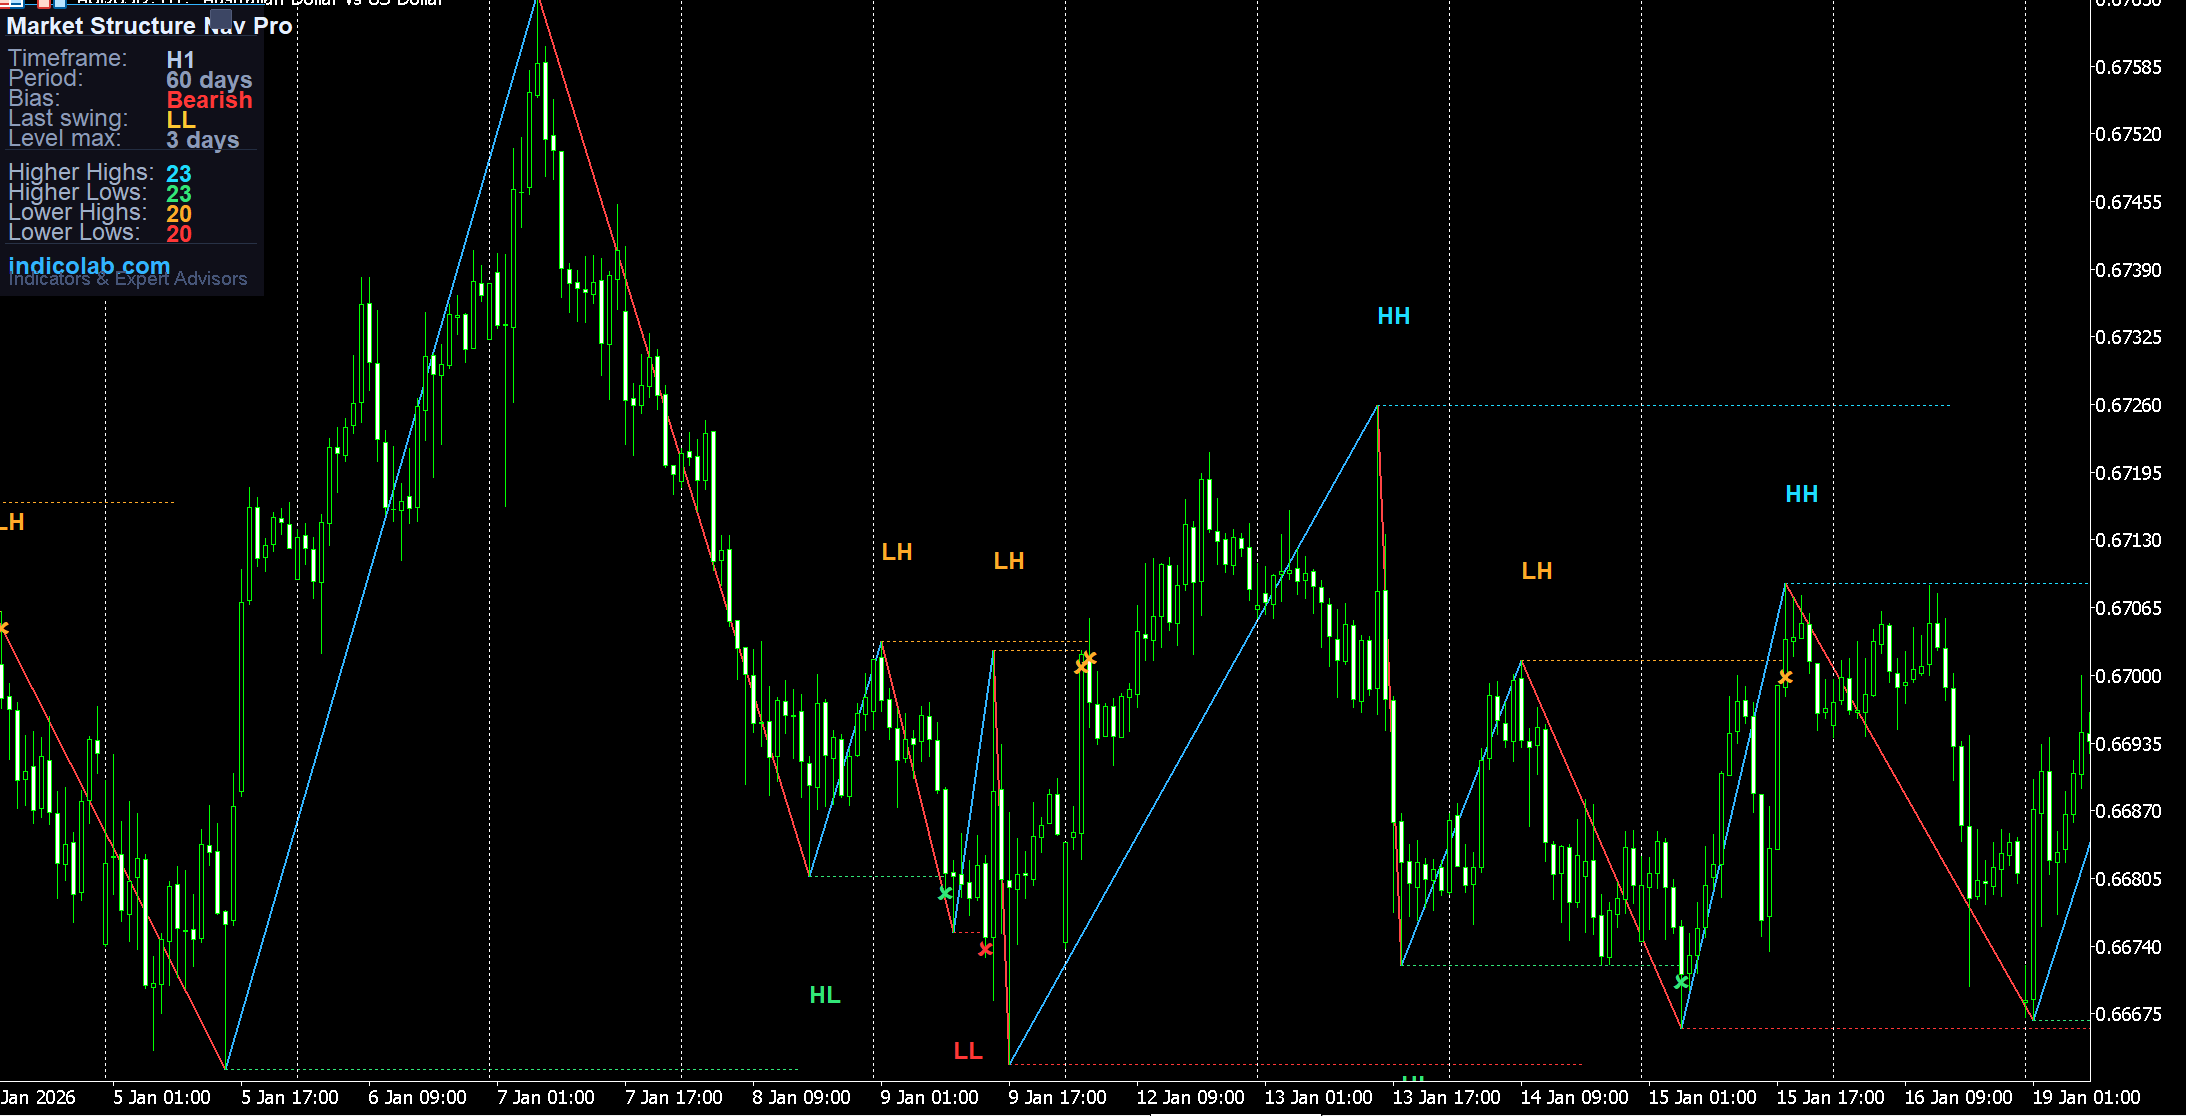
Market Structure Navigator Pro automatically identifies and labels market structure using ZigZag swing points. It marks every swing as HH (Higher High), HL (Higher Low), LH (Lower High), or LL (Lower Low) — giving you instant visual clarity on the current trend direction.
Additionally, the indicator draws horizontal levels from each swing point that extend up to 3 days into the future, stopping when price touches them. This shows you exactly how price reacts to previous swing levels — whether they hold as support/resistance or get broken.
How It Works
The indicator uses the standard ZigZag algorithm to detect swing highs and lows. Each new swing is compared to the previous swing of the same type:
- HH (Higher High) — current high is above the previous high → bullish
- HL (Higher Low) — current low is above the previous low → bullish
- LH (Lower High) — current high is below the previous high → bearish
- LL (Lower Low) — current low is below the previous low → bearish
The Current Bias is determined automatically:
- Two or more consecutive bullish labels (HH + HL) → Bullish
- Two or more consecutive bearish labels (LH + LL) → Bearish
- Mixed → Neutral
Horizontal Levels from Swing Points
Each swing point creates a horizontal line extending to the right:
- Maximum extension: 3 days (configurable via
LevelMaxDays) - If price touches the level, the line stops and an X marker appears at the contact point
- Long untouched line = strong level, price respects it
- Short line with X = weak level, quickly broken
This feature helps you instantly see which levels are holding and which are failing.
Colored ZigZag Lines
The ZigZag lines are colored based on direction for easy reading on dark charts:
- Bright cyan lines for bullish moves (up)
- Bright red lines for bearish moves (down)
- Fully customizable line width and colors
Draggable Statistics Panel
The professional dark-themed panel is fully interactive:
- Drag to any position on the chart
- Minimize with the [_] button (collapse to title bar only)
- Restore with the [+] button
- Help via the [?] button
Panel displays:
- Current timeframe and analysis period
- Current Bias (Bullish / Bearish / Neutral) — color coded
- Last Swing label detected
- Level extension setting
- Counts: Higher Highs, Higher Lows, Lower Highs, Lower Lows
Built-in Help Guide
Press [?] to open an interactive guide covering:
- How swing labels work (HH, HL, LH, LL)
- How horizontal levels work (extension, stop-on-touch)
- Trading ideas and strategies
- Panel usage tips
Trading Strategies
-
Trend Following — In a bullish structure (HH + HL), look for entries at Higher Low levels. In bearish (LH + LL), sell at Lower High levels.
-
Break of Structure (BOS) — When the sequence changes from bullish to bearish or vice versa, it signals a potential reversal. The indicator can alert you automatically.
-
Level Trading — Horizontal levels from swing points act as support/resistance. Untouched levels (long lines) are stronger. Look for price reactions at these levels.
-
Confluence Zones — When multiple swing levels cluster in a narrow zone, it creates a strong support/resistance area. These zones often produce significant price reactions.
-
Volatility Assessment — Many short lines with X marks = choppy market. Long clean lines with fewer touches = trending market with clear levels.
Settings
| Parameter | Default | Description |
|---|---|---|
| ExtDepth | 12 | ZigZag depth (sensitivity) |
| ExtDeviation | 5 | ZigZag deviation |
| ExtBackstep | 3 | ZigZag backstep |
| DaysToShow | 60 | Analysis period in days |
| BullZZColor | Cyan | Bullish ZigZag line color |
| BearZZColor | Red | Bearish ZigZag line color |
| ShowLevels | true | Show horizontal levels |
| LevelMaxDays | 3 | Max days for level extension |
| LevelStopOnTouch | true | Stop level when price hits it |
| HHColor | Cyan | Higher High label color |
| HLColor | Green | Higher Low label color |
| LHColor | Orange | Lower High label color |
| LLColor | Red | Lower Low label color |
| AlertOnHH | false | Alert on Higher High |
| AlertOnLL | false | Alert on Lower Low |
| AlertOnBOS | false | Alert on Break of Structure |
How to Install
- Download the
.mq4file (for MT4) or.mq5file (for MT5) - Copy to
MQL4/IndicatorsorMQL5/Indicatorsfolder - Make sure the standard ZigZag indicator is available (comes with MT4/MT5 by default)
- Restart the terminal or refresh Navigator
- Drag the indicator onto any chart
- Adjust ZigZag parameters and level settings to your preference
Compatibility
- MetaTrader 4 — full support, all timeframes
- MetaTrader 5 — full support, all timeframes (M1-MN)
- Works on any instrument: Forex, Crypto, Metals, Indices, Stocks
- Requires standard ZigZag indicator (included with MetaTrader)
- Minimal CPU usage
Features
- 1. Automatic HH/HL/LH/LL swing labeling with unique colors
- 2. Colored ZigZag lines — cyan for bullish, red for bearish moves
- 3. Horizontal levels from swing points extending up to 3 days
- 4. Smart level termination — line stops when price touches the level
- 5. X markers showing exact level contact points
- 6. Real-time bias detection: Bullish, Bearish, or Neutral
- 7. Draggable panel — move anywhere on the chart
- 8. Collapsible panel — minimize to title bar, restore with one click
- 9. Break of Structure (BOS) alerts with push notifications
- 10. Built-in interactive help guide with trading strategies