📈
SwingMap Navigator
IndicatorMT4MT5v1.0$10.00
Overview
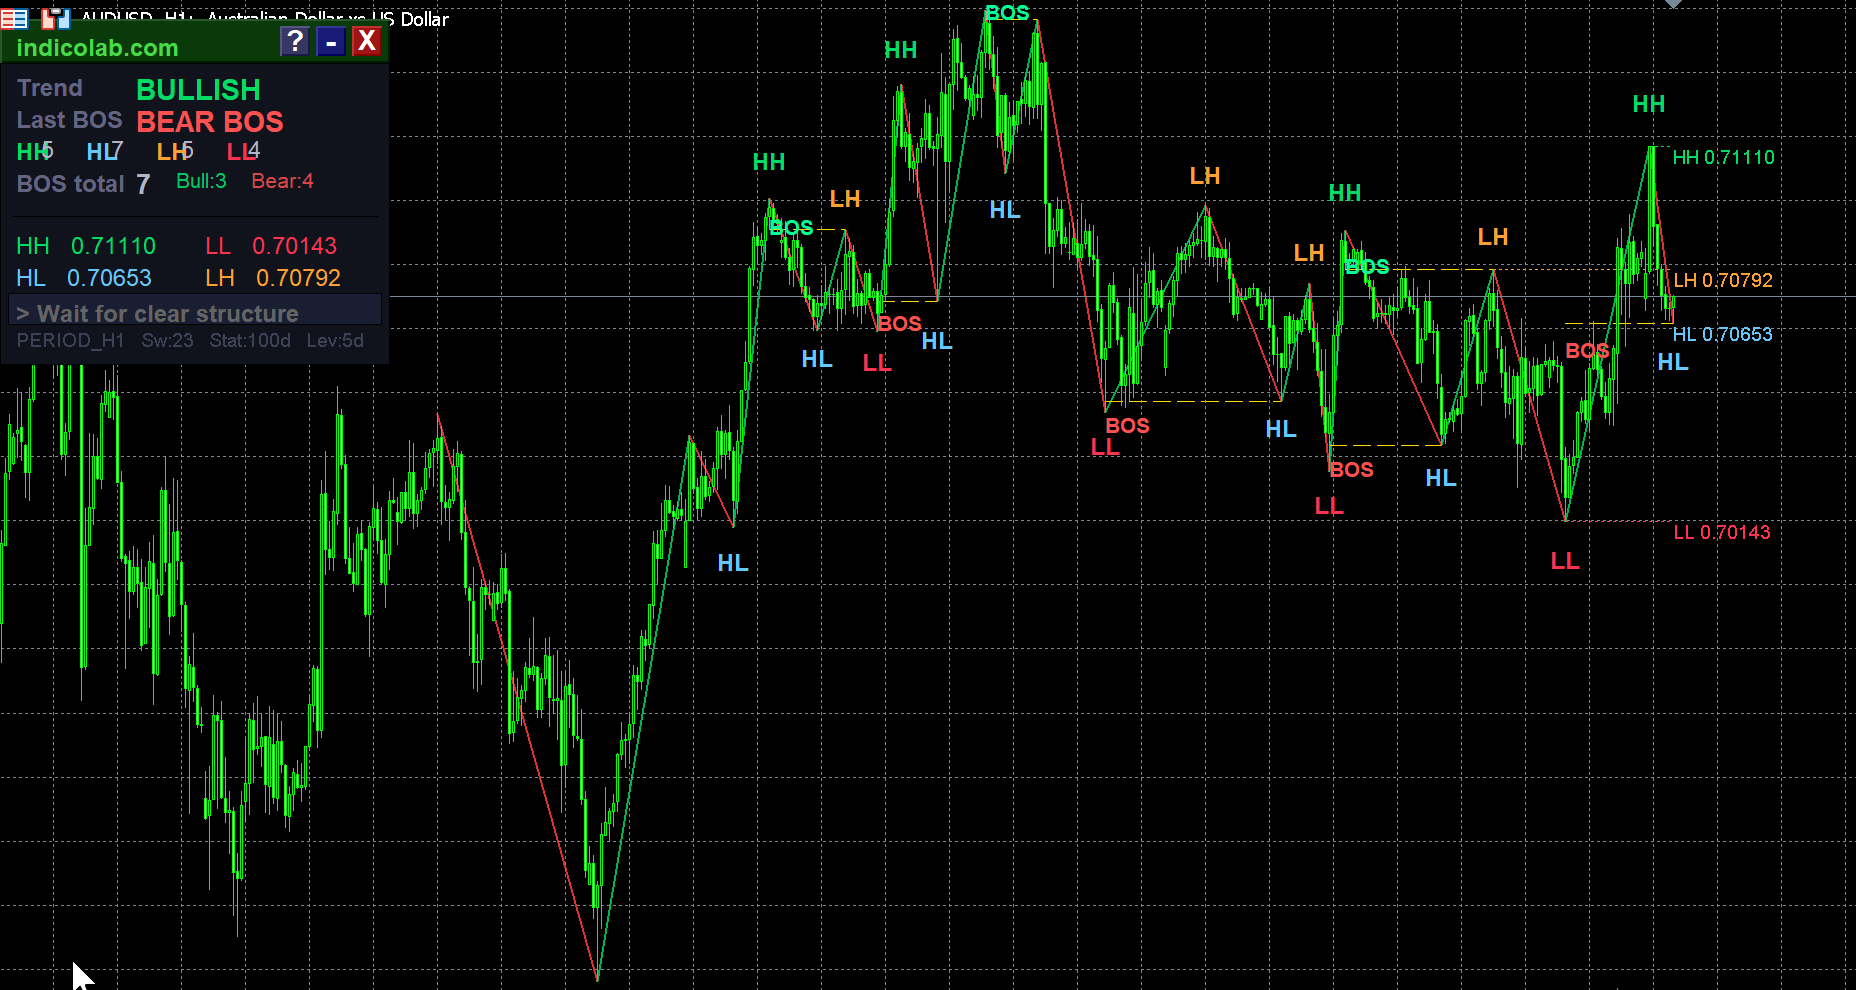
SwingMap Navigator is a professional market structure analysis tool that automatically identifies swing highs and lows using ZigZag, labels them as HH, HL, LH, LL, detects Break of Structure (BOS) events, and displays actionable trading signals on an elegant draggable panel.
Perfect for Price Action, Smart Money Concepts (SMC), and ICT-style trading.
How It Works
- The indicator scans ZigZag swing points and compares each with the previous swing
- Labels are assigned: HH (Higher High), HL (Higher Low), LH (Lower High), LL (Lower Low)
- When price breaks a key swing level, a BOS (Break of Structure) is detected
- The panel shows current trend, last BOS, structure counts, key levels, and a strategy recommendation
Trading Strategy
| Condition | Signal |
|---|---|
| BULLISH trend + Bull BOS | LONG — wait for pullback to HL zone |
| BEARISH trend + Bear BOS | SHORT — wait for pullback to LH zone |
| RANGING market | Trade S/R edges — buy support, sell resistance |
Panel Features
- Draggable info panel with minimize / maximize / help buttons
- Trend direction — BULLISH, BEARISH, or RANGING
- Last BOS — Bull BOS or Bear BOS with color coding
- Structure counts — HH, HL, LH, LL totals with individual colors
- BOS statistics — total count, bullish vs bearish breakdown
- Key price levels — last HH, HL, LH, LL with exact prices
- Strategy signal — actionable entry recommendation
- Built-in guide — press ? for full strategy explanation
Chart Elements
- ZigZag lines — green for up moves, red for down moves
- Structure labels — colored HH / HL / LH / LL at each swing point
- BOS markers — golden dashed lines with "BOS" label at break points
- Key level lines — dotted horizontal lines limited to configurable days (default 5)
Parameters
| Parameter | Default | Description |
|---|---|---|
| ExtDepth | 12 | ZigZag depth — higher = fewer swings |
| ExtDeviation | 5 | ZigZag deviation filter |
| ExtBackstep | 3 | ZigZag backstep |
| LevelDays | 5 | Duration of level lines (days) |
| StatDays | 30 | Statistics analysis period (days) |
| MaxSwings | 80 | Maximum swing points to analyze |
| ShowBOS | true | Show Break of Structure detection |
| ShowLevels | true | Show key level lines on chart |
| ShowLabels | true | Show HH/HL/LH/LL labels |
| AlertBOS | true | Alert on new BOS events |
Recommended Settings
| Trading Style | Timeframes | StatDays | ExtDepth |
|---|---|---|---|
| Scalping | M5, M15 | 7 | 8–10 |
| Day Trading | M30, H1 | 30 | 12 |
| Swing Trading | H4, D1 | 90 | 12–20 |
| Position | D1, W1 | 180 | 20–30 |
Installation
MetaTrader 4:
- Copy
SwingMap_Navigator.mq4toMQL4/Indicators/ - Ensure standard ZigZag indicator is present
- Restart MT4 → drag indicator onto chart
MetaTrader 5:
- Copy
SwingMap_Navigator.mq5toMQL5/Indicators/ - Standard ZigZag should be in
MQL5/Indicators/Examples/ - Compile in MetaEditor → drag onto chart
Features
- Automatic HH / HL / LH / LL structure labeling
- Break of Structure (BOS) detection with alerts
- Built-in trading strategy with entry signals
- Draggable info panel with minimize and help buttons
- Key level lines limited to N days (configurable)
- Customizable statistics period (StatDays)
- Color-coded ZigZag lines (green up / red down)
- Works on all timeframes and instruments
- Built-in strategy guide (press ? button)
- Available for both MT4 and MT5
Loading...