TrendPulse Analyzer v7
What Is TrendPulse Analyzer?
TrendPulse Analyzer v7 is a professional-grade multi-currency scanner that gives you a complete picture of the forex market in a single panel. Instead of switching between 28 charts and 8 timeframes, you see everything at once — which pairs are trending up, which are trending down, and which ones have no clear direction.
The indicator combines three proven technical methods — EMA crossovers, SuperTrend, and price-trend alignment — into a single Fuzzy Logic score that weighs higher timeframes more heavily (because they're more reliable). The result is a clear, actionable number from -1.00 to +1.00 for every pair.
How It Works
When you attach TrendPulse Analyzer to any chart, it automatically detects all available forex pairs on your broker and scans them across M5, M15, M30, H1, H4, D1, W1, and MN timeframes. For each pair and timeframe, it checks:
- Fast EMA (8) vs Slow EMA (21) — determines short-term direction
- Price vs Trend EMA (50) — confirms the overall trend
- SuperTrend confirmation — adds a volatility-based layer
Each timeframe gets a direction: UP, DN, or Neutral. Then the Fuzzy Logic engine combines all 8 timeframes using weighted averaging — giving D1 the highest weight at 20%, followed by MN at 17%, W1 at 16%, and H4 at 15%.
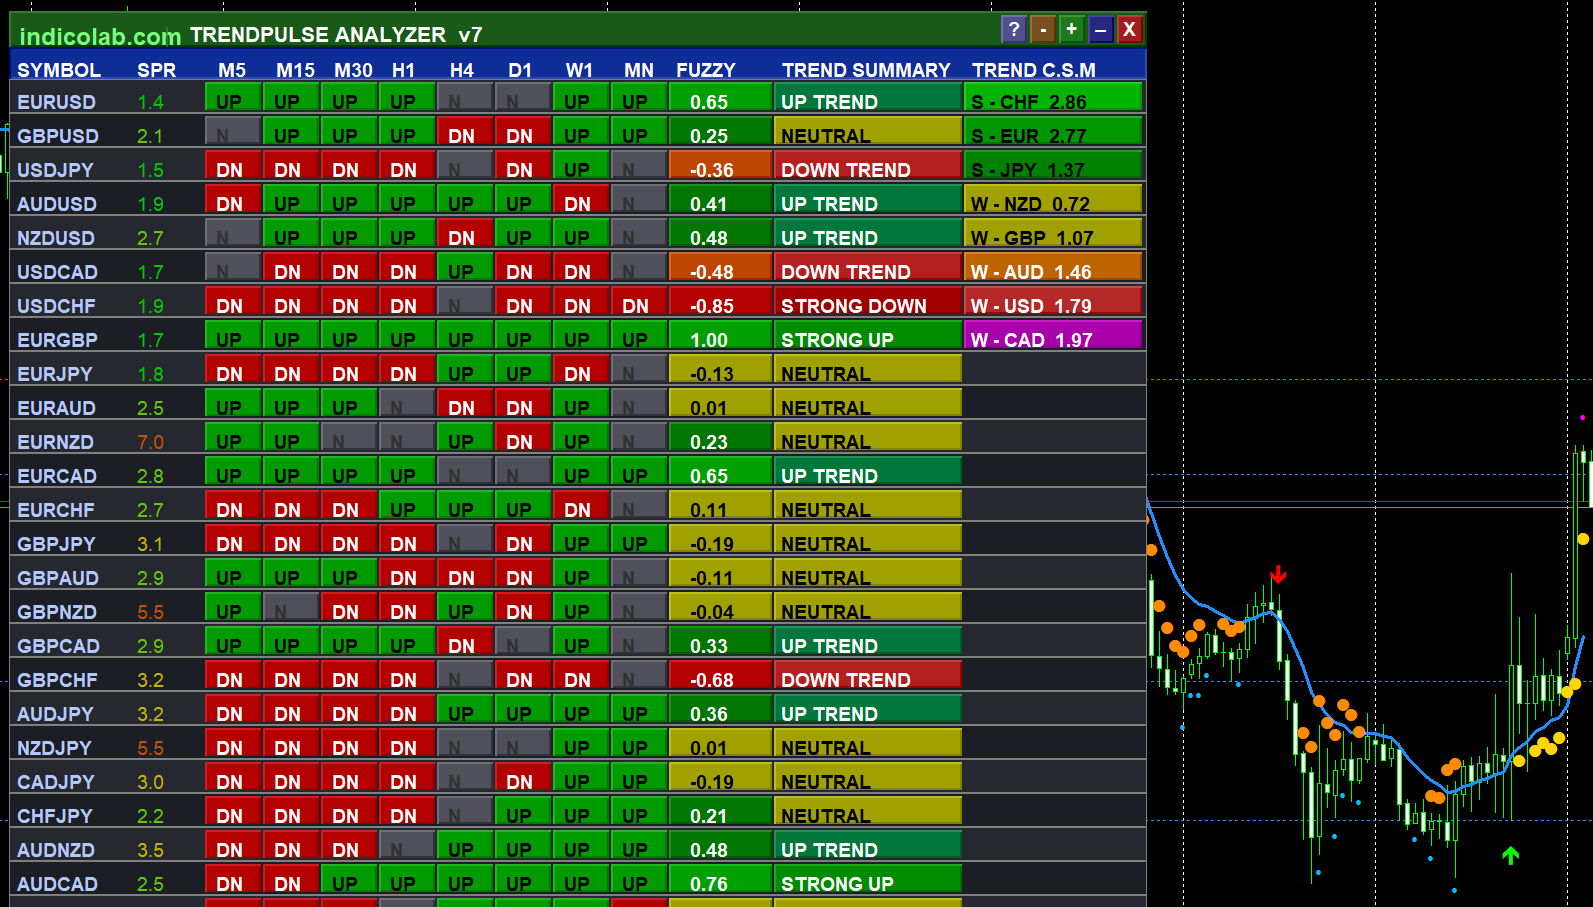
The Scanner Panel
The scanner appears as a dark, professional-looking table directly on your chart. You can drag it anywhere, zoom in/out, or minimize it to just the title bar.
Columns:
| Column | What It Shows |
|---|---|
| SYMBOL | Currency pair name. Click to open in new chart. |
| SPR | Current spread in pips. Color-coded: green = cheap, red = expensive. |
| M5 – MN | Trend direction per timeframe. Green UP, red DN, gray N. |
| FUZZY | Weighted trend score from -1.00 to +1.00. |
| TREND | Human-readable: Strong Up, Up Trend, Neutral, Down Trend, Strong Down. |
| C.S.M. | Currency Strength Meter — ranks 8 currencies strongest to weakest. |
Currency Strength Meter (C.S.M.)
The rightmost column ranks all 8 major currencies by strength. It analyzes directional data from all pairs containing each currency and adds momentum from H1 price changes. The top 3 currencies are labeled S (Strong) in green, the bottom 3 are labeled W (Weak) in red.
Trading tip: The strongest signals come from pairing the strongest currency (BUY as base) with the weakest currency (SELL as quote). For example, if AUD is #1 Strong and JPY is #8 Weak, AUDJPY becomes a high-conviction BUY.
Chart Indicators
Beyond the scanner panel, TrendPulse draws directly on your price chart:
- Trend Line — Blue for uptrend, orange for downtrend
- Buy/Sell Arrows — Green up arrow (buy), red down arrow (sell) with EMA cross + MACD + ATR filter
- Reversal Dots — Cyan (bullish RSI reversal), magenta (bearish)
- Strength Dots — Gold dots when ADX > 25 confirms strong movement
- Support/Resistance — Automatic dotted lines at key price levels
Fuzzy Logic Weights
| Timeframe | Weight |
|---|---|
| M5 | 5% |
| M15 | 7% |
| M30 | 8% |
| H1 | 12% |
| H4 | 15% |
| D1 | 20% |
| W1 | 16% |
| MN | 17% |
Higher timeframes collectively account for 68% of the score.
Trend Summary
| Verdict | Fuzzy Range | Hint |
|---|---|---|
| STRONG UP | +0.70 to +1.00 | High-confidence bullish — look for BUY entries |
| UP TREND | +0.30 to +0.69 | Moderate bullish — BUY on pullbacks |
| NEUTRAL | -0.29 to +0.29 | Mixed signals — wait for clarity |
| DOWN TREND | -0.69 to -0.30 | Moderate bearish — SELL on rallies |
| STRONG DOWN | -1.00 to -0.70 | High-confidence bearish — look for SELL entries |
Panel Controls
| Button | Action |
|---|---|
| [ ? ] | Toggle glossary/help panel |
| [ - ] | Zoom out |
| [ + ] | Zoom in |
| [ _ ] | Minimize to title bar |
| [ X ] | Hide panel |
| Drag | Move panel by title bar |
| Click pair | Opens in new chart window |
Installation
MetaTrader 4
- Download
TrendPulse_Analyzer.mq4 - Open MT4 → File → Open Data Folder
- Navigate to
MQL4/Indicators/ - Copy the file and restart MT4
- Drag onto any forex chart
- Enable Allow DLL imports in Common tab
MetaTrader 5
- Download
TrendPulse_Analyzer.mq5 - Open MT5 → File → Open Data Folder
- Navigate to
MQL5/Indicators/ - Copy the file and restart MT5
- Drag onto any forex chart
- Enable Allow DLL imports in Common tab
Important: DLL imports must be enabled because the license validation uses Windows Internet API (wininet.dll).
FAQ
Q: Why does the panel show all "N" and "0.00" when I first load it? A: On MT5, the indicator needs 5-10 seconds to download historical data for all 28 pairs. Data appears automatically.
Q: The panel is too big / too small. A: Use [ - ] and [ + ] buttons to zoom from 50% to 150%.
Q: How do I see only specific signal types?
A: Change SigMode parameter: Trend, Reversal, Scalp, or All.
Q: Why are some pairs missing? A: The scanner only shows pairs available on your broker.
Q: Can I drag the panel? A: Yes, click and hold the green title bar to drag anywhere.
Q: How often does it update?
A: Every 3 seconds by default. Adjustable via UpdateSec parameter (1-60s).
Features
- 28-Pair Scanner — scans all major and cross pairs automatically
- 8 Timeframes — monitors M5 through MN simultaneously
- Fuzzy Logic Scoring — weighted algorithm, -1.00 to +1.00
- Currency Strength Meter — real-time ranking of 8 currencies
- Smart Spread Monitor — color-coded from green to red
- One-Click Chart Opening — click any pair to open new window
- Buy/Sell Arrows — EMA cross + MACD + ATR multi-filter signals
- Auto Support/Resistance — fractal-based key levels
- Zoom & Minimize — scale 50%-150%, collapse to title bar
- Built-in Glossary — press [?] for interactive help panel
- Draggable Panel — professional 3D design, drag anywhere
- Multi-Platform — identical on MT4 and MT5