WaveBand Trend Pro
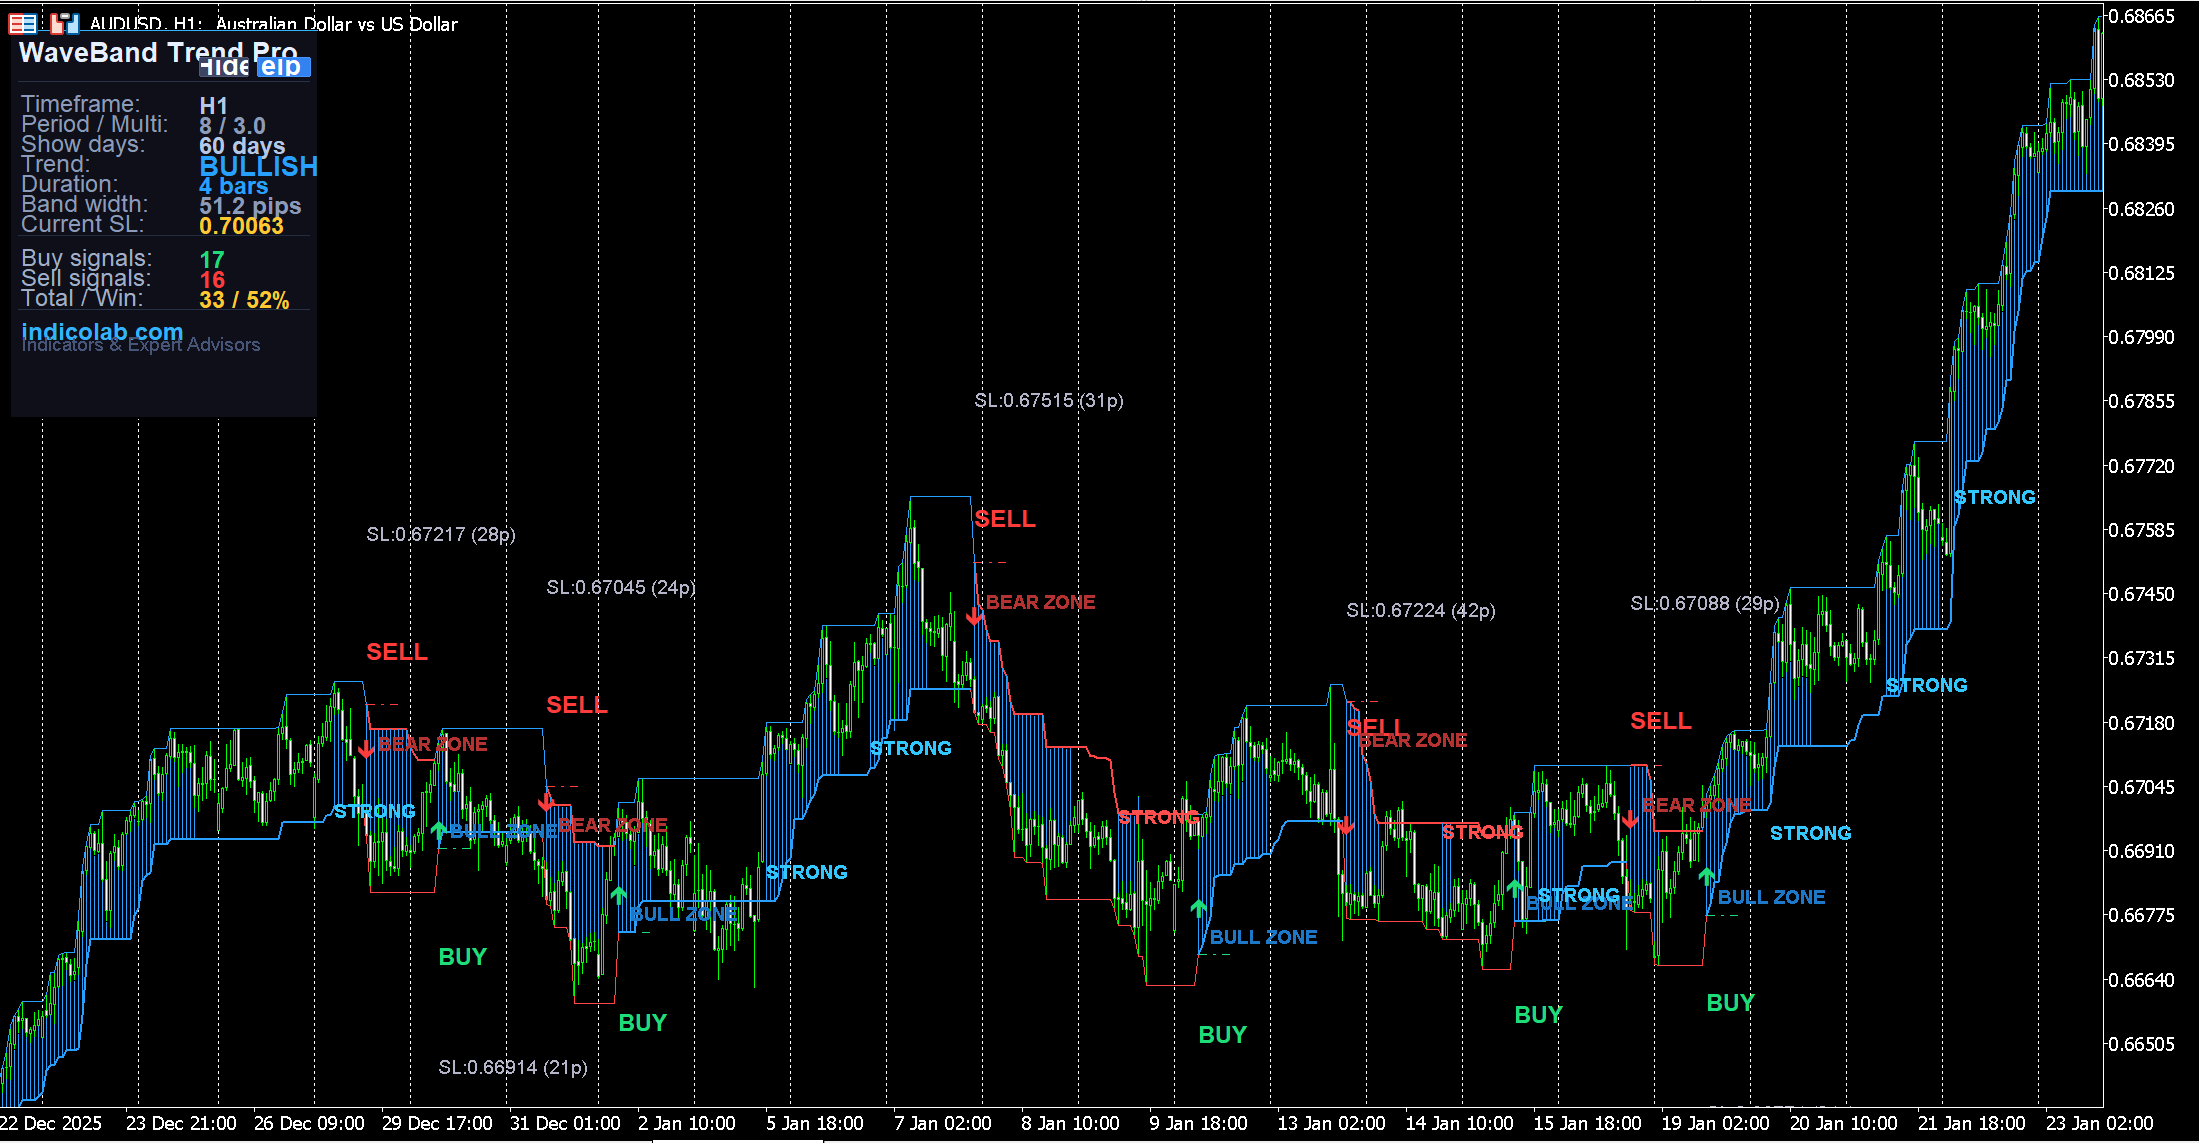
WaveBand Trend Pro detects trend direction using a combination of SMMA and LWMA moving averages, then builds adaptive ATR-based trailing bands around price. When trend flips, the indicator shows clear BUY/SELL signals directly on the chart — with exact stop-loss prices and pip distances.
Unlike simple moving average crossovers, WaveBand uses a three-layer detection system: SMMA(High), LWMA(Weighted), and SMMA(Low) to confirm trend changes only when price momentum truly shifts.
What You See on the Chart
Every signal element is labeled directly on the chart so you know exactly what to do:
- BUY — green text label + green arrow at trend flip to bullish
- SELL — red text label + red arrow at trend flip to bearish
- SL:1.08523 (25p) — exact stop-loss price and distance in pips shown under each signal
- Dash-dot SL line — visual stop-loss level extending across several bars
- BULL ZONE / BEAR ZONE — text label marking the start of each trend zone
- STRONG — appears when trend accelerates (LWMA breaks above SMMA High or below SMMA Low)
- Histogram shading — colored area highlighting strong trend momentum
All labels are spaced to avoid overlapping — BUY/SELL signals below/above price, ZONE labels shifted sideways inside the band, STRONG markers only on non-signal bars.
Trailing Band System
The core of the indicator is the adaptive trailing band:
- Blue thick line (bullish) = trailing stop that rises with the trend, never goes down
- Red thick line (bearish) = trailing stop that falls with the trend, never goes up
- Thin boundary lines = ATR-based outer envelope showing the full volatility range
- Band width adjusts automatically with market volatility (ATR-based)
The trailing band acts as a dynamic stop-loss: place your SL at the band level and trail it as the band moves in your favor.
Statistics Panel
The draggable dark-themed panel shows real-time analytics:
- Trend: BULLISH / BEARISH / Neutral (color-coded)
- Duration: how many bars the current trend has lasted
- Band width: current channel width in pips
- Current SL: the exact trailing stop-loss price right now
- Buy / Sell signals: count over the analysis period
- Total / Win rate: total signals and percentage that moved in the right direction
- Show days: configurable analysis period (20 / 60 / 100 / 500 / 1000 days)
Win rate is color-coded: green (>55%), yellow (>45%), red (<45%).
DaysToShow — Full History Control
Set DaysToShow to control how much history is displayed:
20— short-term analysis, recent signals only60— default, covers about 3 months100— medium-term view500— roughly 2 years of signals1000— full long-term backtest view
ALL visual labels (BUY, SELL, SL, BULL ZONE, BEAR ZONE, STRONG) are drawn for the entire period — scroll back through history and see every signal that occurred.
Trading Strategy
- Entry: When BUY or SELL arrow appears with text label
- Stop-Loss: Place at the SL level shown under the signal (exact price given)
- Trail Stop: Move SL along the thick trailing band as it advances
- Add Position: When "STRONG" label appears — trend is accelerating
- Exit: On opposite signal arrow, or when price hits the trailing band
Settings
| Parameter | Default | Description |
|---|---|---|
| Period | 8 | MA / ATR smoothing period |
| Multiplier | 3.0 | ATR band width multiplier |
| DaysToShow | 60 | Days of history to display (20-1000) |
| ShowShade | true | Show strength histogram |
| ShowSignals | true | BUY/SELL arrows |
| ShowSignalLabels | true | BUY/SELL text + SL info on chart |
| ShowSLLines | true | Dash-dot stop-loss lines |
| ShowZoneLabels | true | BULL ZONE / BEAR ZONE labels |
| ShowStrongMarks | true | STRONG acceleration markers |
| ArrowOffset | 12 | Signal arrow distance in pips |
| AlertOnFlip | false | Popup alert on signal |
| PushOnFlip | false | Push notification on signal |
How to Install
- Download the
.mq4file (for MT4) or.mq5file (for MT5) - Copy to
MQL4/IndicatorsorMQL5/Indicatorsfolder - Restart the terminal or refresh Navigator
- Drag onto any chart and adjust DaysToShow to your preference
Compatibility
- MetaTrader 4 — full support, all timeframes
- MetaTrader 5 — full support, all timeframes (M1-MN)
- Works on any instrument: Forex, Crypto, Metals, Indices, Stocks
- Uses built-in MA and ATR (no external dependencies)
- Minimal CPU usage
Features
- 1. Adaptive ATR trailing bands with automatic volatility adjustment
- 2. On-chart BUY/SELL text labels with exact stop-loss prices in pips
- 3. Visual SL lines (dash-dot) at each signal for instant reference
- 4. BULL ZONE / BEAR ZONE labels marking trend direction changes
- 5. STRONG markers highlighting trend acceleration moments
- 6. Configurable DaysToShow (20-1000) — see ALL signals across full history
- 7. Win rate statistics calculated over the entire analysis period
- 8. Draggable panel with trend, duration, band width, and current SL
- 9. Built-in interactive help guide with trading strategy
- 10. Alerts and push notifications on trend flip signals
Free Download
This indicator is free. To prevent unauthorized distribution, it is compiled individually for your MetaTrader 4 / MetaTrader 5 trading account. Register and provide your MT4/MT5 account number to receive a personalized file.